
A case from the field: the curve showed the dip, the blood showed the cause
On a large dairy farm, we recently saw the same thing happen in two types of data at once. After calving, the cows stopped eating, resulting in high NEFA levels. Around 40 days in milk, serious liver problems followed.
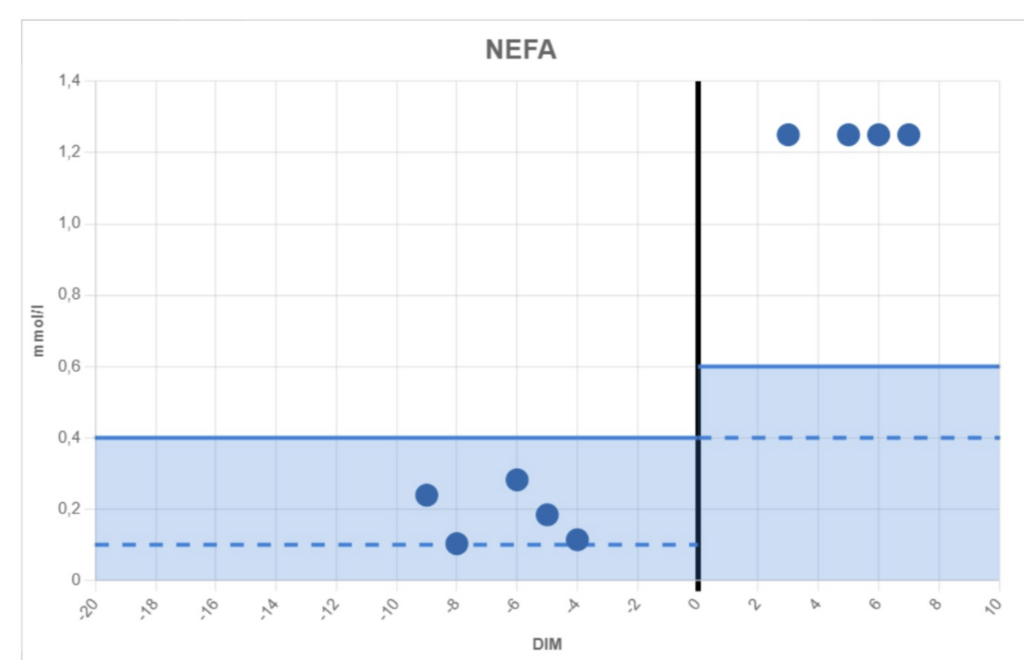
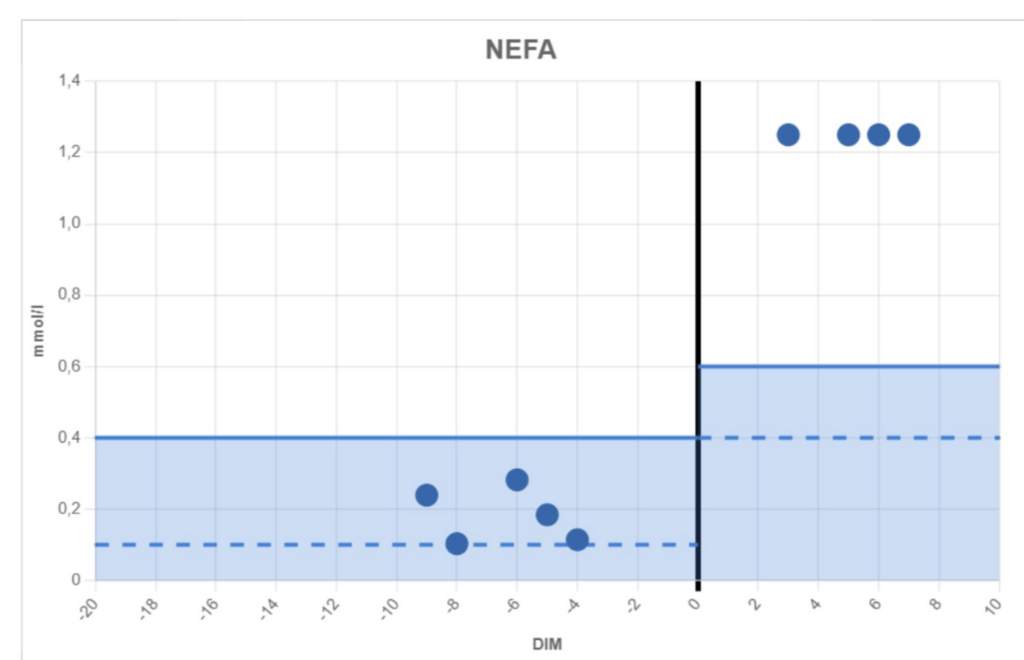
Blood testing with BoviLab showed that NEFA levels were too high. Samples were taken both before and after calving, and the fresh cows stood out. Four of the nine cows sampled were above 1.2 mmol/l, the upper limit of what BoviLab measures.
What does that mean? NEFA shows how much body fat a cow is mobilising. A high NEFA level means a deep energy deficit. The cow is eating too little to meet her requirements and is drawing on her reserves. Those fatty acids put pressure on the liver, and an overloaded liver suppresses feed intake even further. The result: it takes a long time for the cow to get going again after calving.
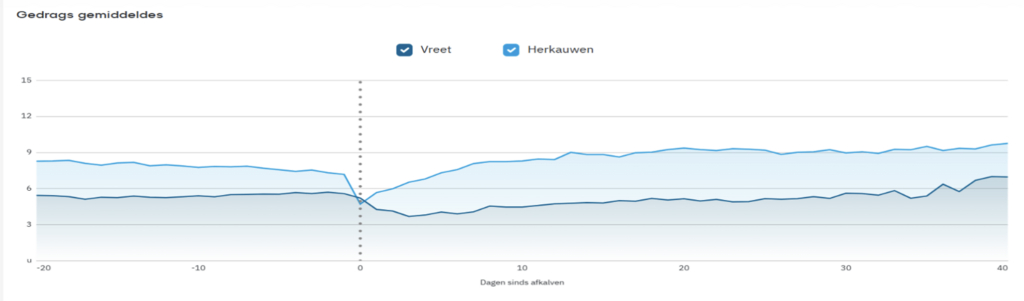
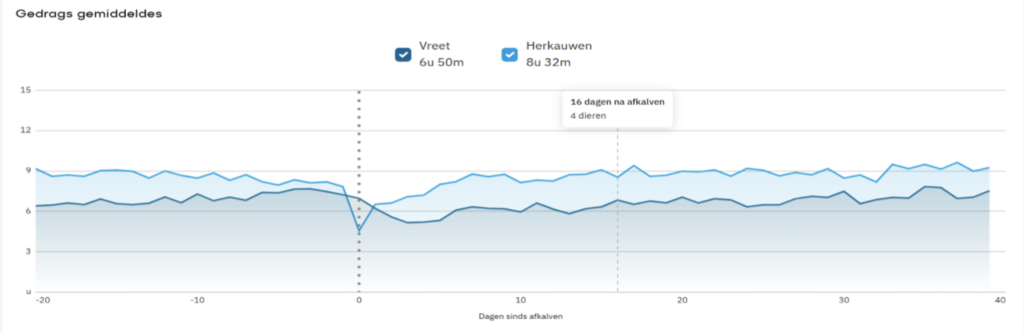
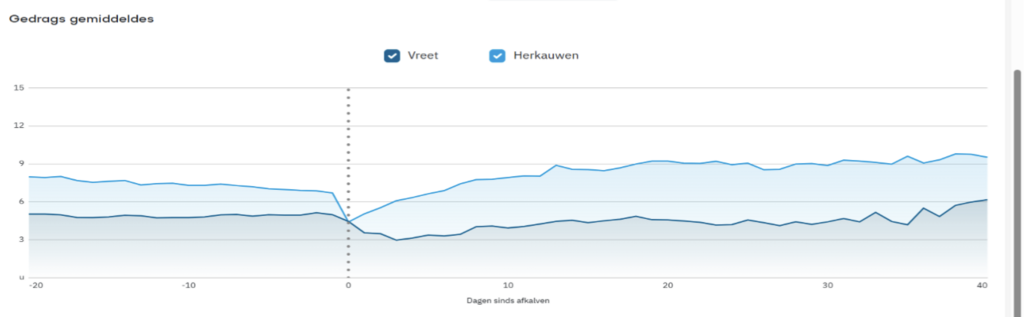
And you can see that in the sensor data. The Nedap curve shows that it takes days for eating time and rumination activity to return to normal levels.
What do you see with sensors alone?
Sensors are very good at showing what is happening. A cow eats less, ruminates less, and you can see it per animal and per day. But mainly you see the effect. Why is she eating less? An energy deficit, a calcium problem, an infection, stress in the calving pen? The curve does not tell you.
What does blood testing add?
On this farm, the veterinarian carries out metabolic profiling as part of the herd health programme. This lets you measure the metabolism behind the behaviour. Now you know that the dip in intake and rumination is linked to fat mobilisation. And because it was the fresh cows that had high NEFA levels, you also know where to look: around calving.
After one or two days in the straw pen, fresh cows go straight into a group of 110 high-yielding cows, with overcrowding at the feed fence. At exactly the time when intake needs to rise, the fresh cow has to compete for her place at the feed fence. And you can see that in the sensor data.
Without blood testing, you would have seen that the cows were slow to get going, but not why. The two sources reinforce each other. The blood points to the cause, the sensors show how big the effect is in the barn. And after an adjustment, both show whether it is working.
On this farm, that is now the next step: fresh cows spend their first 14 days in a separate fresh cow group.

Odkryj, co BoviLab może zrobić dla Ciebie
Nasze inteligentne rozwiązanie daje natychmiastowy wgląd w zdrowie Twoich krów.
Odkryj technologię stojącą za BoviLab lub wypróbuj ją sam dzięki bezpłatnej wersji demo.
